

- Joined
- Sep 14, 2023
- Messages
- 16,668
- Reaction score
- 0
- Points
- 36
Microsoft Excel: Power Pivot, Dax & Pivot Table-Full Course
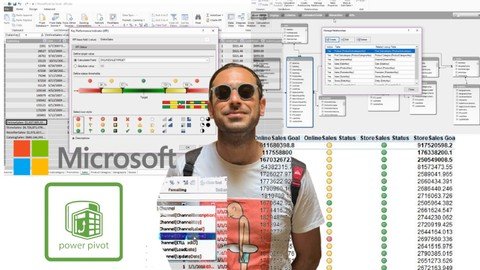
Master Data Analysis/Data Model/BI from Basic: Create Dashboards/ harness DAX/ in a practical manner without the frills
What you'll learn
Master DATA MODELING and manage RELATIONSHIPS with the Microsoft practice file
Acquire essential skills in visualization by creating Pivot Tables and PIVOT CHARTS from integrated datasets
Students will learn about creating and utilizing MEASURES in a PIVOT TABLE using the DATA MODEL
distinguish between IMPLICIT and EXPLICIT MEASURES, understanding how to create your own custom measures using DAX formulas
How to enhance your reporting capabilities by marking DATE TABLES and applying time-based filters
How to utilize the SLICER and TIMELINE tools to improve report filtering and visualization
You will be able to easily filter data by specific criteria which would streamlines the analysis process and also empowers you to make data-driven decisions
You will learn about formula writing and the use of DAX language within the POWER PIVOT environment
You will gain skills in creating calculation columns to derive important financial metrics by using real-world and tangible examples
Concept of HIERARCHY in the DATA MODEL, which allows for effective categorization
Students will gain practical experience in creating their own hierarchies, enhancing their data organization skills
Students will learn about KEY PERFORMANCE INDICATORS (KPIs) and how to create them
present performance metrics clearly in Pivot Tables, making it easier to quickly assess the status of key metrics and identify areas needing attention
Requirements
A version of Excel compatible with Power Query & Power Pivot (2013+)
This course is designed for PC users (Power Pivot is currently unavailable with Excel for Mac)
Basic Excel skills are all you need!
Description
NOTE: Throughout this training course, I've incorporated real-world examples in every session to bring the concepts to life and enhance your understanding.-Do you want to master powerful tools that can elevate your data analysis skills to a professional level?- Want to discover how to turn complex data into clear, actionable strategies that propel your business forward?- Ready to build dynamic reports that not only impress but also enabling you to spot trends and insights with ease?I've designed a clear progression that starts with the fundamentals and gradually builds to more complex concepts, ensuring that each topic flows logically into the next.You'll begin by learning how to create dynamic Pivot Tables. As you advance, you'll explore tools for interactive data filtering, and discover how to use DAX functions. Ultimately, the course culminates in understanding performance evaluationI've streamlined the content to highlight key concepts that are vital for your analytical toolkit, ensuring you leave with practical knowledge that you can apply immediately in your work. Join me and transform your data analysis skills!Headlines:Master Data Modeling with Microsoft practice fileIntroduction to Pivot Tables and Built-in Pivot Table toolsAcquire skills in data visualization: Pivot Tables and Pivot Charts from integrated datasetsAnalyze data over specific periods: Date Tables and time-based filtersImprove report filtering and visualization: Utilize Slicer and TimelineCreate calculation columns with DAX Language and Formula WritingUnderstand Hierarchies to effectively categorize dataPresent performance metrics clearly: Creation of KPIs in Pivot Tables to quickly assess key metrics
Overview
Section 1: From Data to Decisions
Lecture 1 Crafting Dynamic Pivot Tables from Your Data Model Sources
Lecture 2 Implementing Time-Based Filters
Lecture 3 SLICERS, a Feature for Visually Filtering Data
Lecture 4 A Powerful Filter for Date-Based Analysis
Lecture 5 All you need to know about PIVOT CHARTS
Lecture 6 Understanding and Creating CALCULATION COLUMNS
Lecture 7 Introduction and Classification of DAX Functions
Lecture 8 The RELATED Function and its role in Linking Data
Lecture 9 Exploring HIERARCHY
Lecture 10 MEASURES in PIVOT TABLES
Lecture 11 KPIs and Their Importance in Performance Evaluation
Excel Users at All Levels,Students and Recent Graduates: Individuals pursuing careers in business analytics, data evaluation, or related fields,Managers and Executives: Leaders looking to improve their ability to interpret data and KPIs, enabling them to make informed decisions that enhance business performance,Business Analysts and Data Professionals: Individuals seeking to deepen their expertise in data modeling and advanced analytical techniques
Say "Thank You"
rapidgator.net:
ddownload.com:
Published 10/2024
MP4 | Video: h264, 1920x1080 | Audio: AAC, 44.1 KHz
Language: English | Size: 726.34 MB | Duration: 0h 38m
MP4 | Video: h264, 1920x1080 | Audio: AAC, 44.1 KHz
Language: English | Size: 726.34 MB | Duration: 0h 38m
Master Data Analysis/Data Model/BI from Basic: Create Dashboards/ harness DAX/ in a practical manner without the frills
What you'll learn
Master DATA MODELING and manage RELATIONSHIPS with the Microsoft practice file
Acquire essential skills in visualization by creating Pivot Tables and PIVOT CHARTS from integrated datasets
Students will learn about creating and utilizing MEASURES in a PIVOT TABLE using the DATA MODEL
distinguish between IMPLICIT and EXPLICIT MEASURES, understanding how to create your own custom measures using DAX formulas
How to enhance your reporting capabilities by marking DATE TABLES and applying time-based filters
How to utilize the SLICER and TIMELINE tools to improve report filtering and visualization
You will be able to easily filter data by specific criteria which would streamlines the analysis process and also empowers you to make data-driven decisions
You will learn about formula writing and the use of DAX language within the POWER PIVOT environment
You will gain skills in creating calculation columns to derive important financial metrics by using real-world and tangible examples
Concept of HIERARCHY in the DATA MODEL, which allows for effective categorization
Students will gain practical experience in creating their own hierarchies, enhancing their data organization skills
Students will learn about KEY PERFORMANCE INDICATORS (KPIs) and how to create them
present performance metrics clearly in Pivot Tables, making it easier to quickly assess the status of key metrics and identify areas needing attention
Requirements
A version of Excel compatible with Power Query & Power Pivot (2013+)
This course is designed for PC users (Power Pivot is currently unavailable with Excel for Mac)
Basic Excel skills are all you need!
Description
NOTE: Throughout this training course, I've incorporated real-world examples in every session to bring the concepts to life and enhance your understanding.-Do you want to master powerful tools that can elevate your data analysis skills to a professional level?- Want to discover how to turn complex data into clear, actionable strategies that propel your business forward?- Ready to build dynamic reports that not only impress but also enabling you to spot trends and insights with ease?I've designed a clear progression that starts with the fundamentals and gradually builds to more complex concepts, ensuring that each topic flows logically into the next.You'll begin by learning how to create dynamic Pivot Tables. As you advance, you'll explore tools for interactive data filtering, and discover how to use DAX functions. Ultimately, the course culminates in understanding performance evaluationI've streamlined the content to highlight key concepts that are vital for your analytical toolkit, ensuring you leave with practical knowledge that you can apply immediately in your work. Join me and transform your data analysis skills!Headlines:Master Data Modeling with Microsoft practice fileIntroduction to Pivot Tables and Built-in Pivot Table toolsAcquire skills in data visualization: Pivot Tables and Pivot Charts from integrated datasetsAnalyze data over specific periods: Date Tables and time-based filtersImprove report filtering and visualization: Utilize Slicer and TimelineCreate calculation columns with DAX Language and Formula WritingUnderstand Hierarchies to effectively categorize dataPresent performance metrics clearly: Creation of KPIs in Pivot Tables to quickly assess key metrics
Overview
Section 1: From Data to Decisions
Lecture 1 Crafting Dynamic Pivot Tables from Your Data Model Sources
Lecture 2 Implementing Time-Based Filters
Lecture 3 SLICERS, a Feature for Visually Filtering Data
Lecture 4 A Powerful Filter for Date-Based Analysis
Lecture 5 All you need to know about PIVOT CHARTS
Lecture 6 Understanding and Creating CALCULATION COLUMNS
Lecture 7 Introduction and Classification of DAX Functions
Lecture 8 The RELATED Function and its role in Linking Data
Lecture 9 Exploring HIERARCHY
Lecture 10 MEASURES in PIVOT TABLES
Lecture 11 KPIs and Their Importance in Performance Evaluation
Excel Users at All Levels,Students and Recent Graduates: Individuals pursuing careers in business analytics, data evaluation, or related fields,Managers and Executives: Leaders looking to improve their ability to interpret data and KPIs, enabling them to make informed decisions that enhance business performance,Business Analysts and Data Professionals: Individuals seeking to deepen their expertise in data modeling and advanced analytical techniques
Screenshots
Say "Thank You"
rapidgator.net:
Code:
https://rapidgator.net/file/bd2324fbf5f3251d559202c8ce87a33d/evjsi.Microsoft.Excel.Power.Pivot.Dax..Pivot.TableFull.Course.rar.htmlddownload.com:
Code:
https://ddownload.com/t726nnnxr2ll/evjsi.Microsoft.Excel.Power.Pivot.Dax..Pivot.TableFull.Course.rar